How I Built a Data Pipeline That Gave 2,000 Listings a Perfect Score
A real estate XML feed management system that eliminated human error from portal submissions — increasing conversions 35% and click-through rates 40%.
TL;DR — Realtors were spending hours fixing portal quality scores manually. I interviewed 60+ of them, deconstructed the scoring algorithm from official documentation, and designed a four-stage data pipeline that intercepts listings, auto-corrects predictable errors, enriches content with AI and geospatial data, and generates portal-ready XML. Result: 2,000 listings at perfect scores, 35% conversion lift, 40% CTR increase, zero manual QA.
Realtors Were Solving the Wrong Problem
When I started interviewing realtors, I expected to hear about lead quality, CRM friction, or pricing strategy. Instead, I kept hearing the same complaint in different words: the portals are impossible to please. I was the sole product and technical lead on this initiative — I owned discovery, architecture decisions, engineering direction, and stakeholder management end to end.
Real estate listing portals in Brazil — ZAP Imoveis, VivaReal, OLX, all under the Grupo OLX umbrella — use a quality scoring system called the LQS (Listing Quality Score, or Indice de Qualidade dos Anuncios) to rank how listings appear in search results. The underlying score runs 0-100, but in the agency-facing dashboard it translates to a 0-10 scale. Agencies that maintain an 8.0+ average earn the coveted “Selo Nota 10” — a quality seal that signals credibility to buyers and renters. Anything less means lower ranking, fewer eyes, fewer clicks, fewer deals. As ZAP’s own documentation puts it:
“O indice de qualidade dos seus anuncios e um fator muito importante que contribui para a melhoria do posicionamento dos seus anuncios no ranking.”[1]
(“The quality index of your listings is a very important factor that contributes to improving the positioning of your listings in the ranking.”)
Sales managers were frustrated. Receptionists at the front desk were drowning in manual reviews. And realtors — the people who should have been out acquiring new properties and closing deals — were spending hours trying to craft pixel-perfect listings that still came back with deductions.
“I spend more time fixing listing scores than I do selling houses.”
— Paraphrased from multiple realtor interviews
The problem was not that realtors were bad at their jobs. The problem was that humans make small, predictable mistakes — a missing condo fee, an inconsistent description format, a photo count that falls just below the threshold — and the portals penalize every single one.
I believed we could fix this systematically.
The Hypothesis
If we could intercept listing data after human entry but before portal submission, automatically correct the predictable mistakes, and enrich the content to match what portals reward — then every listing could hit a quality score of 10, without requiring realtors to change their workflow.
The key insight was that no existing tool was proactive. Existing tools in the market could syndicate listings across portals. Some could flag errors after the fact. But none of them corrected human-made mistakes before submission. That was the gap.
60+ Interviews and a Stack of Portal Manuals
I did not start by building software. I started by talking to people.
Over the course of several weeks, I interviewed more than 60 realtors across multiple stores. The conversations followed a simple structure: walk me through how you create a listing, show me where you get stuck, tell me what you wish was different.
Going in, I assumed sales managers were the primary beneficiaries — they were the ones reviewing listings manually and sending them back with corrections, so logically they had the most to gain from automation. The interviews flipped that assumption. Sales managers were frustrated, yes, but the real pain was downstream. Receptionists at the front desk were drowning in corrections — catching typos, fixing Portuguese grammatical mistakes, flagging incomplete financial fields — because sales managers had started outsourcing the review work to them. The team had become over-perfectionist trying to achieve quality manually, and it was eating into everyone’s productivity. Realtors were losing selling time to listing polishing instead of doing what they were actually good at: knowing the property, meeting clients, closing deals. The pipeline would be a relief not because it automated a task, but because it let people focus on what they knew best instead of format compliance.
Three patterns emerged consistently from the interviews:
- Realtors understood the portal rules in theory but could not consistently apply them in practice. They knew descriptions mattered, they knew photos mattered, but the specifics of what the portal algorithm actually rewards were opaque to them.
- Sales managers were acting as quality gatekeepers, manually reviewing listings before submission and sending them back with corrections. This created a bottleneck that slowed onboarding of new properties.
- The feedback loop was too slow. By the time a listing was flagged by the portal for a low score, days had passed. The realtor had moved on to other work. Fixing it was context-switching overhead.
Armed with those findings, I turned to the portal documentation itself. ZAP Imoveis and VivaReal both publish official quality guides through Canal Pro — the unified dashboard that Grupo OLX provides for managing listings across ZAP, VivaReal, and OLX. ZAP calls its system the LQS; VivaReal runs an equivalent tool called the completometro (completeness meter). Both evaluate listings on the same 0-100 scale.
Deconstructing the LQS
I went through ZAP’s official documentation[2] and mapped every scoring criterion to a concrete, automatable rule. The portal does not publish exact per-field point weights, but the documentation is explicit about what is evaluated. Combining the official criteria with estimated weights from third-party practitioners[3], I built the following scoring map:
| LQS Criterion | What Portals Evaluate | Est. Weight | Common Human Error |
|---|---|---|---|
| Pricing | Sale/rental price + condo fee + IPTU, or marked exempt | 15-25 pts | Missing condo fee or IPTU fields left null |
| Full address | All location fields with valid CEP (postal code) | 15-20 pts | ”S/N” as street number, invalid characters in CEP |
| Description | 100+ characters (50+ for lots); recommends 4+ keywords and nearby POIs | 15-20 pts | Copy-pasted templates with phone numbers, HTML artifacts, company names |
| Property characteristics | Bedrooms, parking, suites, area, extras fully populated | 10-15 pts | Null fields left blank because data was not handy |
| Photos | Minimum 15, recommends 20+, horizontal orientation | 20-25 pts | Listings submitted with 5-8 photos |
| Virtual tour / video | Optional but scored; YouTube links or 360 tour URLs | 5-10 pts | Missing entirely or non-HTTPS links |
Note: ZAP does not publish exact per-field point weights. The estimated weights above come from third-party practitioner analysis, not official documentation. The criteria themselves are documented by ZAP.
For descriptions specifically, I went deeper — performing semantic research on top-performing listings to understand what patterns correlated with higher engagement. I interviewed salespeople about which descriptions they believed performed best and cross-referenced their intuitions with the official ZAP recommendation of including at least four keywords and references to nearby points of interest[4].
This analysis became the foundation for everything we built. Every one of the 22 rules in our business rules engine maps to a specific criterion in this table.
Designing the Solution: A Four-Stage Pipeline
Before committing to a pipeline approach, I evaluated three alternatives. The first was training realtors to follow portal rules more carefully — but interviews had already proven the problem was human error at scale, not lack of knowledge. Even well-trained realtors made predictable mistakes under production volume. The second was building a linting UI that would flag errors before submission, but this still required realtors to act on every flag — adding friction to a workflow they already resented. The third was pressuring the property management system vendor to add native validation, but that vendor’s roadmap was outside my control and the timeline was measured in quarters, not weeks. The approach I chose — an invisible pipeline that intercepts data and corrects it automatically, requiring zero behavior change from realtors — was not the obvious path. It was a deliberate product decision: the highest-adoption solution is one that demands nothing from the user.
The architecture I designed treats listing data as a pipeline — raw input goes in one end, portal-ready XML comes out the other. Each stage adds a layer of quality.
flowchart TD
    A[/"XML Feeds from Property Management System"/] --> B["1. Sync — Incremental Database Upsert"]
    B --> C["2. Enrich — Google Places Geospatial Data"]
    C --> D["3. AI Descriptions — Structured Content Generation"]
    D --> E["4. Generate XML — 22 Business Rules & Quality Enforcement"]
    E --> F[("Portal Distribution via Cloudflare R2")]
Stage 1: Sync — Ingest Without Disruption
The adoption constraint shaped everything here: if the system required realtors to change any part of their workflow, it would fail. The 60+ interviews made this non-negotiable — realtors were already frustrated, and any new tool that added steps would be ignored or resented.
The first design decision was critical: do not change how realtors work. They already had a property management system where they entered listing data. That system already generated XML feeds. Rather than asking anyone to learn a new tool, we would consume their existing output.
The syncer downloads XML feeds, parses them with a streaming SAX parser (to handle arbitrarily large files without memory pressure), and performs an incremental upsert into PostgreSQL. New listings are inserted, changed listings are updated field-by-field, and listings removed from the feed are hard-deleted.
The incremental approach was deliberate. Early prototypes did a full replace on every sync, which caused unnecessary write amplification and made it impossible to track what actually changed. Field-level diffing meant we could trigger downstream enrichment only when relevant data changed — for example, regenerating an AI description only when the source description was modified, or re-geocoding only when the address changed.
Stage 2: Enrich — Add Context Realtors Cannot
The user insight here was simple but important: realtors think in addresses, not geospatial context. They know the street and neighborhood, but they do not systematically catalog nearby subway stations, schools, or parks — because that is not how they experience the property. Portals, however, reward exactly this kind of structured context. This was a gap the system could close without asking realtors to think differently about their listings.
We integrated the Google Places API to automatically geocode each listing and fetch nearby points of interest within a 1km radius — transit stations, schools, hospitals, supermarkets, parks. This data enriches the listing record and feeds directly into the AI description generator.
Stage 3: AI Descriptions — Consistency at Scale
With 80+ realtors creating listings, description quality was a variance problem, not a competence problem. The product question was not “how do we make every realtor a better writer?” but “how do we guarantee a quality floor across thousands of listings without bottlenecking on human review?”
This was the most carefully researched stage. Original listing descriptions were not necessarily bad — but they were inconsistent. Some realtors wrote excellent copy. Others pasted templates. Some included phone numbers or company names (which portals penalize). The variance in quality meant the portal experience was unpredictable.
My research into portal quality signals — cross-referencing ZAP’s official quality policy[5] with my own semantic analysis of top-performing listings — revealed specific patterns that high-scoring descriptions shared:
- No company names or contact information in the body text (explicitly penalized by ZAP’s quality policy)
- Property attributes woven naturally into prose — bedrooms, area, location, amenities mentioned contextually rather than as a bulleted spec sheet
- At least four keywords and references to nearby POIs — aligning with ZAP’s official recommendation for description content
- Between 100 and 3,000 characters (50+ for lots) — the API’s accepted range, with longer, richer descriptions correlating with higher scores
- Clean formatting — no HTML artifacts, no trailing codes, no ALL CAPS sections
I designed a structured prompt system that takes every data point we have about a listing — attributes, location, features, nearby transit and amenities — and generates a three-paragraph description in Brazilian Portuguese that follows these patterns precisely. Each description is stored separately from the original, preserving the realtor’s work while ensuring the portal-facing copy meets quality standards.
We iterated on the prompt structure multiple times, cross-referencing output against the patterns I had identified in top-performing listings. The goal was never to produce creative marketing copy — it was to produce consistently correct copy that would not trigger quality deductions.
Stage 4: The Business Rules Engine — 22 Rules, Zero Guesswork
The key product decision for this stage was configurability. Portal scoring criteria can shift — portals update their algorithms, new fields become required, weight distributions change. I designed the rules engine so that every rule is individually toggleable and configurable through the dashboard, without code changes. This meant the operations team could respond to portal updates in hours, not sprint cycles.
This is the core of the system. The XML generator reads enriched listing data from the database and applies 22 configurable business rules before producing the output file. Every rule maps directly to a documented portal quality criterion.
Every rule operates within the portals’ terms of service — correcting predictable human errors and filling gaps with defensible defaults, exactly as ZAP’s official quality guide[2] and quality policy[5] recommend. Every rule traces back to a documented criterion.
Here is one rule that illustrates the thinking:
Rule 09: Financial Field Completion
ZAP’s LQS documentation is explicit: sale/rental price, condominium fee, and IPTU must either be filled or marked as exempt (isento). Missing financial fields are one of the most common human errors because the property management system treats them as optional — but the portal treats them as mandatory. A listing with a null condo fee field loses points even if the property genuinely has no condo fee, because the portal cannot distinguish “no fee” from “forgot to fill in.” This is the exact type of predictable gap between two systems that a pipeline should close automatically. The rule checks for null financial fields and, when the data exists elsewhere in the listing record (e.g., condo fee in a notes field but not in the structured field), promotes it to the correct location. When the data genuinely does not exist, it marks the field as exempt rather than leaving it null — exactly as the portal documentation recommends.
The remaining 21 rules follow similar patterns across different quality dimensions — data normalization (area fields with logical fallbacks for missing or inverted values), description sanitization (stripping HTML artifacts, phone numbers, and company names that trigger policy violations), photo validation, and geospatial enrichment. Each rule maps to a specific portal criterion and operates within the portals’ terms of service.
What We Chose Not to Build
Scope discipline mattered here. Several ideas came up during development that I deliberately cut:
- A listing editor in the dashboard. It would have been natural to build a UI where managers could edit listings directly. I cut it because it would have created a second source of truth alongside the property management system, and the whole point was to not change existing workflows.
- Portal API integrations for direct submission. Instead of uploading XML to Cloudflare R2 for portal consumption, we could have pushed directly to portal APIs. I deferred this because the XML-based workflow was already understood by the team and the portals, and direct API integration would have tripled the integration surface area.
- Automated A/B testing of descriptions. I wanted to test different description styles against each other. Deferred because measuring description impact requires portal-side analytics we do not control.
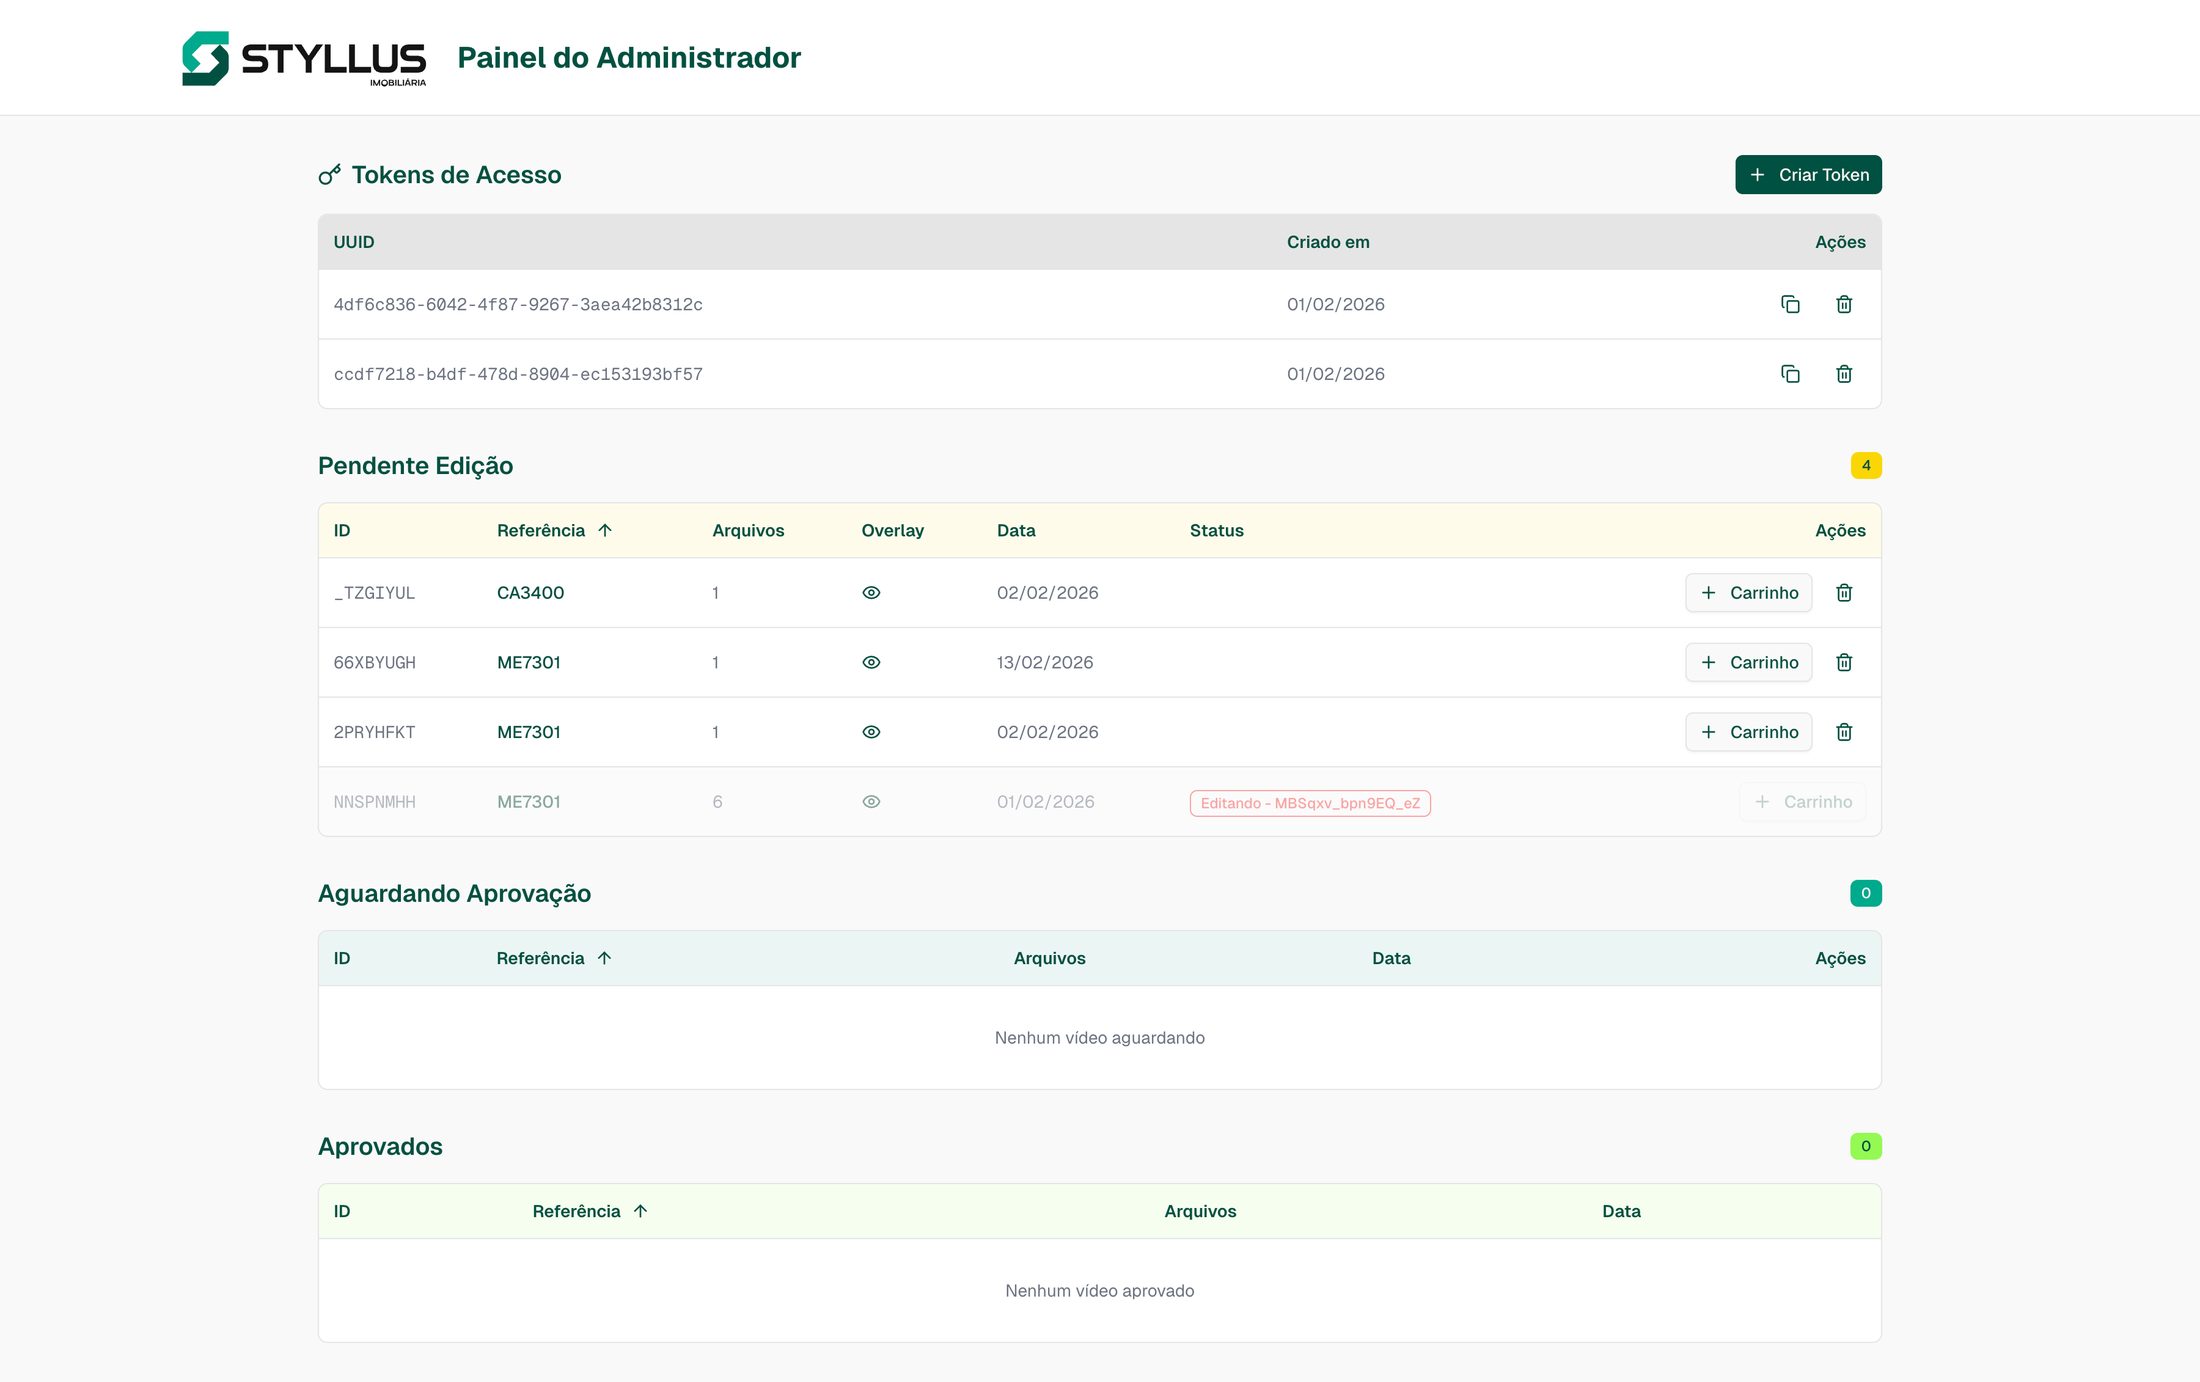
The Dashboard: Making the Pipeline Visible
A pipeline that runs in the background and nobody understands is a pipeline that nobody trusts. The Next.js dashboard exists to make the system legible to the people who depend on it.
Sales managers and receptionists can see:
- When the pipeline last ran and whether it succeeded
- Which listings were synced, enriched, or flagged for manual attention
- Real-time logs streamed from each pipeline stage
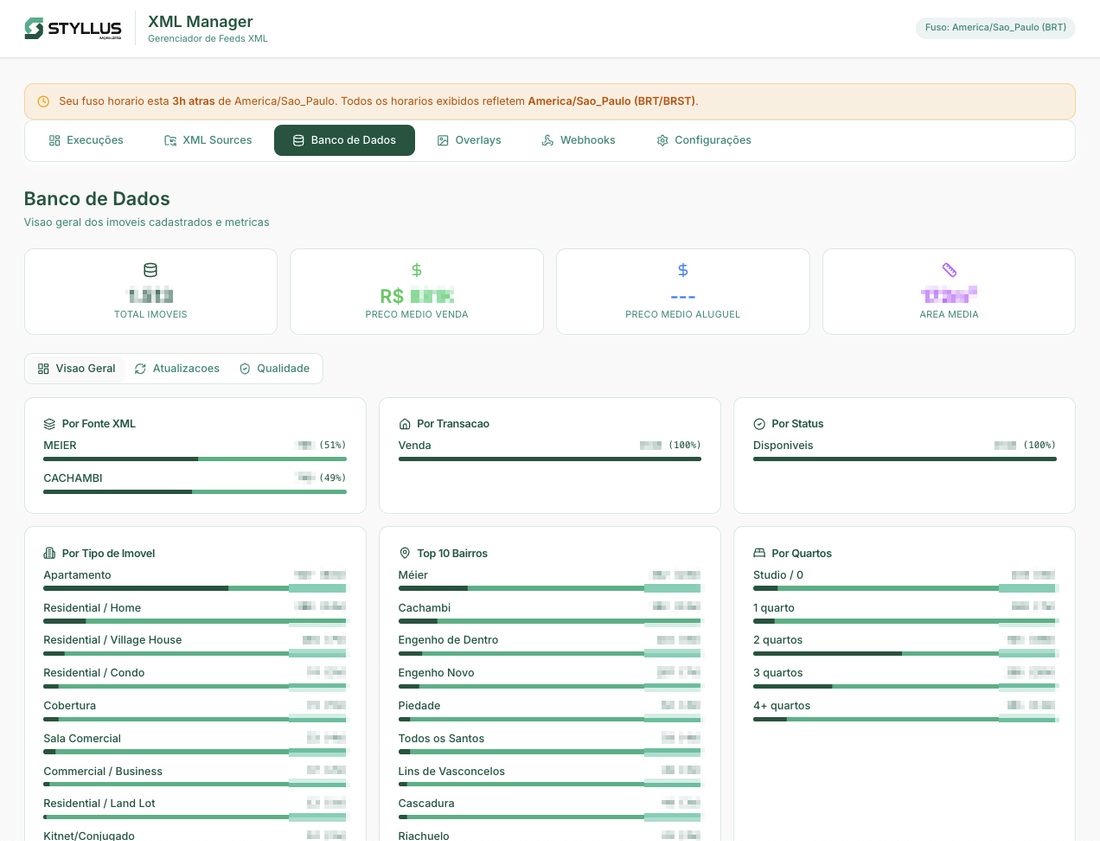
- Database quality metrics — coverage of AI descriptions, Places API enrichment, score distributions
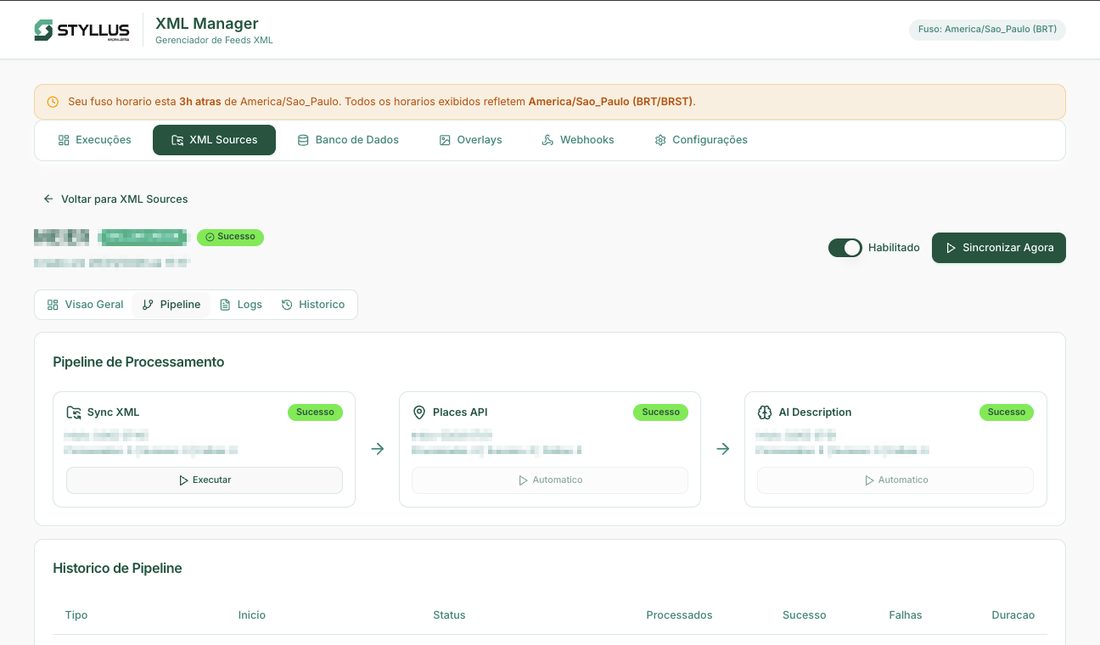
The dashboard also handles scheduling (feeds are generated four times daily), webhook notifications for external integrations, and configuration of the business rules engine — including the ability to enable or disable individual rules without code changes.
Most importantly, the dashboard surfaces cases where automated correction is not possible. When a listing has issues that require genuine human judgment — not just predictable error correction — the system proactively notifies the front desk at the relevant store for manual intervention. This was a deliberate design choice: automate what can be automated, but never silently skip what cannot.
How a Listing Moves Through the System
Every listing follows a clear lifecycle from ingestion to portal delivery — or, when automation cannot resolve an issue, to human intervention:
stateDiagram-v2
    [*] --> Synced : XML feed ingested
    Synced --> Enriched : Google Places geocoding
    Enriched --> AI_Described : Description generated
    AI_Described --> Rules_Applied : 22 business rules pass
    Rules_Applied --> Portal_Ready : XML generated
    Portal_Ready --> Delivered : Uploaded to R2
    Delivered --> [*]

    Rules_Applied --> Flagged : Rule cannot auto-correct
    Flagged --> Manual_Review : Front desk notified
    Manual_Review --> Synced : Realtor fixes source data
When Automation Is Not Enough
The notification flow for flagged listings was one of the most important product decisions. Rather than silently skipping problematic listings or blocking the entire feed, the system isolates the issue and routes it to the right person. When a rule cannot auto-correct a listing, the dashboard creates an alert with the specific issue and notifies the front desk at the relevant store. The receptionist fixes the source data in the property management system, and the next sync cycle picks up the correction automatically.
Results
The system now processes 2,000 active listings, generating portal-ready XML feeds four times a day.
| Metric | Before | After |
|---|---|---|
| Listings at quality score 10/10 | Inconsistent, manually achieved | 100% of listings |
| Conversion rate | Baseline | +35% |
| Click-through rate | Baseline | +40% |
| Manual quality review | Hours per day, per store | Automated, with exception-based alerts |
| Feed generation frequency | Automatic via ERP, but low quality | 4x daily, fully optimized |
These results are consistent with broader market patterns — other practitioners optimizing for LQS completeness have reported similar or even larger gains[6].
The numbers that matter most, though, are not the technical ones. They are these: realtors stopped spending time fixing portal scores. They now focus on what they are actually good at — ensuring listing information is complete and accurate, acquiring new properties, and closing deals. The system handles everything else.
Driving adoption required hands-on training across the organization. I trained two operations coordinators and the front-desk receptionists on pipeline operations, aligned sales management and directors on the benefits, and ran a company-wide training session for realtors on how to provide complete listing data in their ERP — replacing “best attempt” descriptions with structured input that the pipeline could optimize.
The shift in realtor behavior was the outcome I cared about most. The quality scores, the CTR, the conversion lift — those are consequences. The cause was giving people back time they were wasting on a problem a machine should solve.
Lessons and Reflections
Research was the highest-leverage activity. The 60+ realtor interviews and the portal manual analysis took weeks. But the research is what made the engineering productive. Without understanding the exact quality criteria, I would have built a system that automated the wrong things. The broader PM lesson: discovery is not a phase you complete before building — it is the thing that determines whether what you build matters. I now structure discovery as the first deliverable of any project, not a prerequisite to the “real” work.
Incremental automation beats big-bang replacement. The system does not replace the property management software, the realtors’ workflow, or the portal submission process. It sits between them, quietly correcting mistakes. That is why adoption was not a problem — there was nothing to adopt. The existing process just started producing better results. This is a principle I carry into every product decision now: the fastest path to adoption is removing friction, not adding features. If your solution requires behavior change, you are competing with inertia — and inertia almost always wins.
If I were starting over, I would invest earlier in monitoring and alerting. The dashboard was a later addition, and during the early weeks, the pipeline ran somewhat opaquely. Building observability from day one would have accelerated trust-building with the operations team. This taught me something about stakeholder management: operations teams do not trust systems they cannot see into. Visibility is not a feature — it is a prerequisite for organizational buy-in. The dashboard should have been part of the MVP, not a fast-follow.
By the time of my departure, the pipeline had expanded to support 7+ syndication partners, scaled to all stores, and gained multi-cloud redundancy to avoid downtime. The architecture supports additional portal formats and feed sources. The business rules engine is fully configurable — new rules can be added and existing rules can be toggled without code changes. The foundation is there for scaling beyond the current portal ecosystem.
[1] ZAP Imoveis, "Indice de Qualidade dos Anuncios (LQS)" -- [ajuda.zapimoveis.com.br](https://ajuda.zapimoveis.com.br/s/article/indice-de-qualidade-dos-anuncios-lqs) ↩
[2] ZAP Imoveis, "Como aumentar o LQS do anuncio" -- [ajuda.zapimoveis.com.br](https://ajuda.zapimoveis.com.br/s/article/como-aumentar-o-lqs) ↩
[3] Agil Academy, "Canal Pro -- Como ter um melhor posicionamento de anuncios" -- [cursos.agil.net](https://cursos.agil.net/10-2-canal-pro-zap-olx-vivareal-como-ter-um-melhor-posicionamento-de-anuncios/) ↩
[4] ZAP Imoveis, "Como criar um anuncio" -- [ajuda.zapimoveis.com.br](https://ajuda.zapimoveis.com.br/s/article/como-criar-um-anuncio) ↩
[5] ZAP Imoveis, "Politica de Qualidade" -- [ajuda.zapimoveis.com.br](https://ajuda.zapimoveis.com.br/s/article/politica-de-qualidade) ↩
[6] ConectaImobi, "Como aumentei 5x o numero de contatos recebidos" -- a practitioner case study documenting 70% visualization increase and 6x lead contacts after optimizing listings via VivaReal's completometro. [blog.conectaimobi.com.br](https://blog.conectaimobi.com.br/como-aumentei-5x-o-numero-de-contatos-recebidos-com-as-melhorias-do-vivapro/) ↩